Fig 1.
Study area—The Tibet Autonomous Region (Tibet) of the People’s Republic of China.
Source of map: https://www.worldofmaps.net/typo3temp/images/chinakarte.jpg.
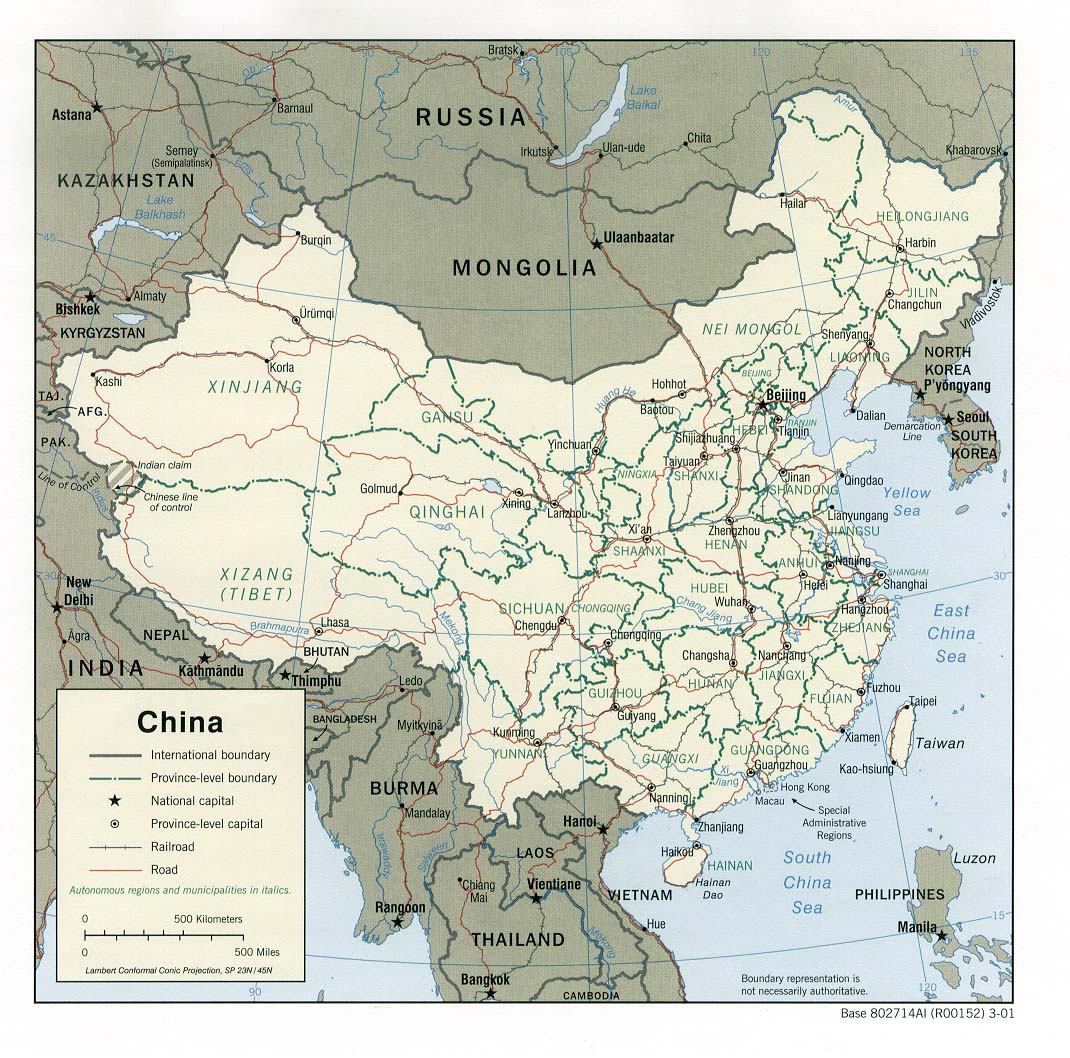
Fig 2.
Direct determinants and environmental proxies.
Note: Symbols of fox and rat in “Direct determinants” section were shown in grey due to data missing.
Fig 3.
Spatial distribution of environmental proxies.
Note: A = Yak population, B = Sheep population, C = Dog population, D = Population, E = GDP, F = Minimum temperature, G = Maximum temperature, H = Relative humidity, I = Precipitation, J = Terrain, K = Land use type, L = NDVI. Abbreviations: GDP, gross domestic product; NDVI, normalized difference vegetation index. Source of map: https://www.worldofmaps.net/typo3temp/images/chinakarte.jpg.
Fig 4.
Schematic diagram of the geographical detector.
A Study region, G grid system, H geographical stratum.
Table 1.
Description of interactive results.
Fig 5.
Spatial distribution patterns of Echinococcosis prevalence in Tibet.
(A) CE prevalence at city level; (B) CE prevalence at county level; (C) AE prevalence at city level; (D) AE prevalence at county level. Source of map: https://www.worldofmaps.net/typo3temp/images/chinakarte.jpg.
Table 2.
Prevalence at city level of CE and AE in Tibet.
Table 3.
Top 10 counties of Tibet in terms of prevalence for CE and AE.